Key Takeaways
- 01
AI PMO Dashboards give executives a centralized view of project health, risks, costs, resources, and performance. - 02
Predictive insights help leaders identify potential delays, risks, and budget issues before they affect project outcomes. - 03
Effective PMO KPIs focus on decision critical information instead of overwhelming executives with unnecessary project data. - 04
Executive dashboards should combine portfolio health, financial metrics, risks, forecasts, and strategic business outcomes. - 05
ChatPM simplifies executive reporting by connecting project data with AI-powered insights and intelligent dashboards.
Traditional PMO reporting often relies on static reports that make it difficult for executives to see changing project conditions. An AI PMO Dashboard brings project data, risks, performance, and forecasts into one view. As a result, leaders can quickly understand portfolio health and make informed decisions based on timely, actionable insights.
Modern project dashboards should provide clear metrics, predictive insights, and concise executive reporting without overwhelming decision-makers with unnecessary data. In addition, they should highlight critical issues, emerging risks, resource concerns, and performance trends at a glance. In this blog, we explore the key metrics every executive should track.
Take your project management to the next level with AI-powered automation. Schedule a ChatPM Pro demo to see how AI can automate routine tasks, streamline workflows, improve project visibility, and help your team save 10+ hours every week.
What is an AI PMO Dashboard?
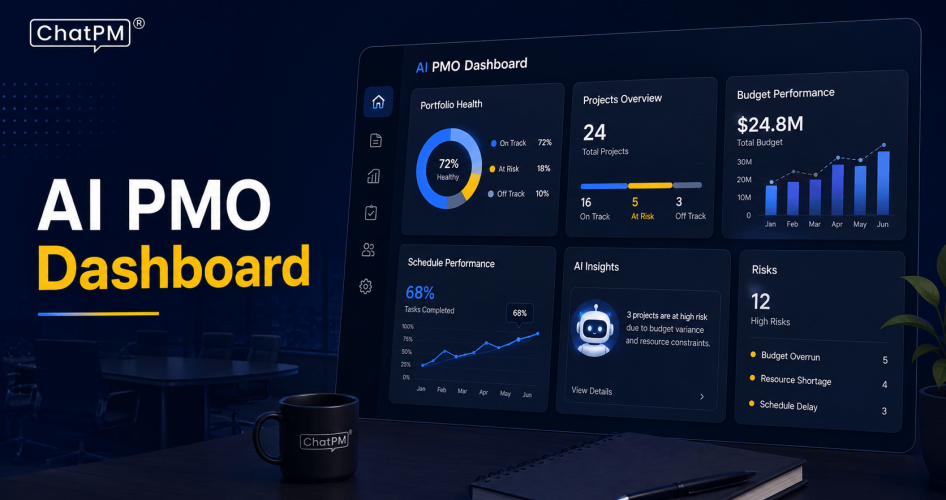
An AI PMO Dashboard is a centralized platform that gives executives and PMO leaders a clear view of project and portfolio performance. It brings data from different projects into one dashboard, covering areas such as schedules, budgets, resources, risks, milestones, and overall project health.
Unlike traditional dashboards, an AI PMO Dashboard can analyze project data and identify patterns that may require attention. Furthermore, AI can highlight unusual changes, predict potential delays, summarize project performance, and surface important insights without requiring leaders to review multiple reports manually.
The dashboard also supports faster reporting by presenting complex project information in a simple and actionable format. As a result, leaders can focus on critical issues, understand current performance, and make informed decisions using a consistent view of portfolio data.
Why Do Executives Need an AI PMO Dashboard?
Executives need clear, timely information to understand project performance and respond to issues quickly. An AI PMO Dashboard provides a centralized view of critical project data and highlights areas requiring attention.
1. Faster Portfolio Visibility
Executives can view overall project health in one place. As a result, this reduces time spent reviewing separate reports.
2. Early Risk Identification
AI can detect warning signs across project data. Therefore, leaders can address potential risks before they affect delivery.
3. Better Resource Decisions
The dashboard shows how resources are allocated across projects. In addition, this helps leaders identify capacity gaps and allocation issues.
4. Improved Budget Control
Executives can compare planned and actual project spending. Consequently, this makes cost concerns easier to identify and manage.
5. Proactive Decision-Making
AI can identify trends and provide predictive insights. As a result, leaders can act before small issues become major problems.
6. Consistent Reporting
A centralized dashboard creates a common view of project performance. Therefore, this improves consistency across executive and PMO reporting.
10 Key Metrics Every Executive Should Track
An effective AI PMO Dashboard should focus on metrics that directly support executive decisions. In particular, these KPIs provide visibility into project health, financial performance, risks, resources, and business outcomes.
1. Project Health and Overall Portfolio Status
Shows the current health of individual projects and the overall portfolio. As a result, executives can quickly identify projects needing attention.
2. Schedule Performance
Tracks planned timelines against actual project progress. Therefore, it helps identify delays before they affect delivery.
3. Budget and Cost Performance
Compares planned project costs with actual spending. In addition, executives can quickly spot budget variances and cost concerns.
4. Resource Utilization
Shows how resources are allocated across active projects. As a result, it helps identify capacity gaps and resource bottlenecks.
5. Risk Exposure
Highlights active risks based on their likelihood and business impact. Furthermore, AI can help prioritize risks requiring immediate action.
6. Project Delivery Performance
Measures progress against planned milestones and delivery targets. Consequently, it helps executives understand whether projects are progressing as expected.
7. Scope and Change Management
Tracks scope changes and their impact on project delivery. Therefore, this helps prevent uncontrolled changes from affecting timelines and budgets.
8. Business Value and ROI
Connects project performance with expected business outcomes. As a result, executives can evaluate whether investments are delivering the intended value.
9. Team and Productivity Metrics
Tracks workload, task completion, and project blockers. In addition, it helps identify productivity issues that may affect delivery.
10. Forecast Accuracy and Predictive Insights
Compares projected outcomes with actual project results. Furthermore, AI can improve forecasts for schedules, costs, risks, and resource needs.
How AI Enhances Traditional PMO KPIs?
Traditional PMO KPIs show what is happening across projects, while AI helps explain what may happen next. As a result, this makes project reporting more predictive, actionable, and useful for executive decisions.
1. Predictive Risk Analysis
AI analyzes project data to identify potential risks early. Therefore, leaders can address issues before they impact delivery.
2. Automated Anomaly Detection
AI can detect unusual changes in project performance. Consequently, this helps PMOs investigate problems before they become critical.
3. AI Generated Project Summaries
AI converts complex project data into concise summaries. As a result, executives can understand key updates without reviewing lengthy reports.
4. Natural Language Queries
Leaders can ask questions about projects using simple language. In addition, AI can quickly provide relevant project insights and metrics.
5. Intelligent Recommendations
AI can identify patterns and suggest possible actions. Therefore, this helps executives respond to project issues more effectively.
What an Executive Level Project Dashboard Should Show?
An executive project dashboard should present important information clearly without unnecessary details. In particular, it should help leaders understand portfolio performance and focus on decisions that need immediate attention.
1. Portfolio Health at a Glance
Shows the overall status of active projects. As a result, executives can quickly identify healthy and struggling projects.
2. Critical Projects and Exceptions
Highlights projects facing major issues or delays. Therefore, this helps leaders focus on areas requiring immediate action.
3. Financial and Resource Indicators
Displays budget performance and resource utilization. In addition, leaders can identify financial or capacity concerns quickly.
4. Top Risks and Emerging Issues
Shows the most significant current and emerging risks. Consequently, this supports faster risk response and mitigation.
5. Forecasts and Recommended Actions
Provides AI-driven predictions for project outcomes. Furthermore, it can highlight actions that may improve performance.
6. Strategic Alignment and Business Outcomes
Connects projects with organizational goals and expected results. As a result, executives can assess whether projects support strategic priorities.
Best Practices for Building an Effective AI PMO Dashboard
A useful AI PMO Dashboard should prioritize clarity, accuracy, and actionable insights. Following the right practices helps executives get reliable information without unnecessary complexity.
1. Focus on Decision Critical Metrics
Include KPIs that directly support business decisions. Therefore, avoid filling the dashboard with irrelevant data.
2. Integrate Project Data
Connect data from relevant project and business systems. As a result, this creates a consistent view of portfolio performance.
3. Standardize KPI Definitions
Use consistent definitions for every metric across projects. In addition, this makes executive reporting easier to compare and understand.
4. Keep Data Updated
Use real time or regularly refreshed project information. Consequently, updated data helps leaders respond to changing conditions.
5. Use Role Based Views
Provide dashboard views based on executive and PMO responsibilities. As a result, each user can focus on the information relevant to their role.
6. Combine Historical and Predictive Insights
Review past performance alongside AI-driven forecasts. Therefore, this provides better context for future project decisions.
Is Your PMO Ready for Smarter Executive Decision Making?
An AI PMO Dashboard gives executives a clearer view of project health, costs, resources, risks, schedules, and business outcomes. By combining real-time data with predictive insights, it helps leaders identify issues earlier and make faster, informed decisions. As a result, the right metrics can turn project reporting into strategic business intelligence.
ChatPM helps organizations strengthen executive reporting with AI-powered project management and intelligent dashboards. In addition, it brings project data, KPIs, risks, costs, schedules, and performance insights together for better visibility. With ChatPM, leaders can simplify reporting, identify critical issues, and make confident decisions across their project portfolio.