Key Takeaways
- 01
AI dashboards give executives a clearer view of project performance, risks, resources, costs, and priorities. - 02
Traditional reporting can delay decisions because information remains fragmented across multiple systems and reports. - 03
AI helps identify emerging risks, performance changes, and portfolio concerns before they become larger problems. - 04
Combining AI with BI creates faster reporting, intelligent analysis, and stronger executive decision making. - 05
ChatPM connects project management, AI, and BI to improve portfolio visibility and leadership oversight.
Project portfolios generate vast amounts of data across budgets, schedules, resources, risks, and performance metrics. As a result, an AI Executive Dashboard helps leaders turn this information into clear, actionable portfolio visibility. Instead of waiting for manual reports, executives can quickly identify priorities, understand project health, and make informed decisions using current business data.
Traditional reporting often leaves executives with fragmented information and limited context for strategic decisions. In contrast, AI powered dashboards bring portfolio performance, risks, trends, and key metrics into one centralized view, helping leaders focus on what needs attention. In this blog, we explore how AI Executive Dashboards improve project portfolio management and executive reporting.
Make project management faster, smarter, and more efficient with AI. Book a ChatPM Pro demo to see how AI-powered project management software can automate routine tasks, reduce manual work, and help your team save 10+ hours every week.
What is an AI Executive Dashboard?
An AI Executive Dashboard is a centralized platform that turns project and portfolio data into clear, actionable insights for business leaders. It brings information such as project status, budgets, timelines, risks, resources, and KPIs into one view. As a result, executives can understand overall portfolio performance without reviewing multiple reports.
Unlike traditional executive dashboards that mainly display historical data, AI powered dashboards can identify patterns, highlight emerging risks, and surface important changes. Meanwhile, BI supports data visualization and reporting, while AI adds intelligent analysis to real-time project data. Together, they help executives move from simply viewing information to making faster, data driven decisions.
Why Traditional Project Portfolio Reporting Falls Short?
Traditional portfolio reporting often depends on manually collected data from different project teams and systems. As a result, this process takes time and can create inconsistencies across reports. By the time executives review the information, important changes in project performance, resource availability, costs, or risks may have already occurred.
Static reports also provide limited context for decision making. In particular, they show what has happened but rarely explain why performance is changing or what requires immediate attention. Executives may therefore need to compare multiple dashboards, spreadsheets, and status reports before understanding the bigger portfolio picture.
Common challenges include:
1. Fragmented information
Data remains distributed across project management and business systems. Consequently, leaders may need to gather information from multiple sources before making decisions.
2. Delayed reporting
Manual updates can make portfolio information outdated. As a result, executives may not have the latest information when reviewing project performance.
3. Limited risk visibility
Emerging issues may remain unnoticed until they affect project outcomes. Therefore, teams may have less time to respond before risks become more significant.
4. Resource uncertainty
Leaders may struggle to see capacity problems across multiple projects. In addition, limited visibility can make resource allocation more difficult.
5. Slow decision making
Teams spend valuable time collecting information instead of acting on it. Consequently, important portfolio decisions may take longer than necessary.
How AI Executive Dashboards Transform Project Portfolio Management?
AI powered dashboards improve portfolio management by connecting project data and turning it into timely insights. Instead of relying on separate reports, executives can view portfolio health, identify concerns, and understand where action may be required. As a result, teams gain a more connected view of portfolio performance.
1. Centralized Portfolio Visibility
AI brings project performance, budgets, schedules, resources, and risks into one executive view. As a result, leaders can review important portfolio information more efficiently.
2. Early Risk Identification
AI helps spot emerging risks and performance changes before they become major portfolio issues. Therefore, executives can focus attention on areas that may require earlier intervention.
3. Real Time Performance Tracking
AI helps monitor important project metrics as they change across the portfolio. In addition, this gives executives a more current view of project performance.
4. Resource and Capacity Insights
AI helps identify resource constraints, workload imbalances, and potential allocation issues. Consequently, leaders can review capacity concerns before they affect project delivery.
5. Faster Executive Decisions
AI gives leaders relevant insights that support quicker and more confident portfolio decisions. As a result, executives can spend less time gathering information and more time acting on important developments.
Key Capabilities of an AI Executive Dashboard
An effective executive dashboard should present the information leaders need to evaluate portfolio performance and take timely action. In addition, it should make important changes and areas of concern easy to identify.
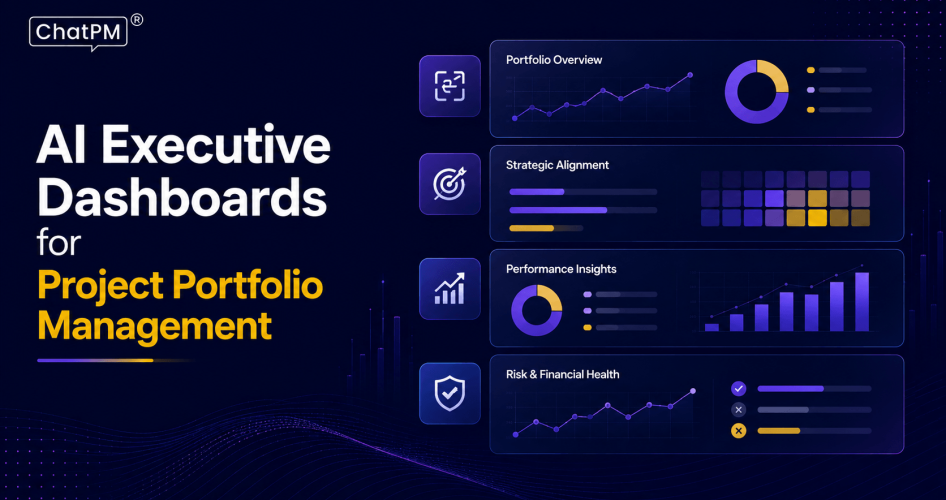
1. Portfolio Health Overview
Shows the overall status of projects, priorities, and performance. This helps leaders understand the broader portfolio position quickly.
2. Risk and Issue Monitoring
Highlights critical risks, unresolved issues, and areas requiring attention. As a result, executives can focus on problems that may need immediate action.
3. Budget and Cost Visibility
Tracks planned spending, actual costs, and budget variations. Therefore, leaders can identify financial changes and review potential budget concerns earlier.
4. Resource Utilization
Provides visibility into resource allocation, workload, and capacity. In addition, this helps leaders understand whether resources are being used effectively across projects.
5. Schedule and Milestone Tracking
Monitors deadlines, milestones, delays, and schedule changes. Consequently, executives can identify portfolio-level schedule concerns more quickly.
6. KPI Monitoring
Displays important performance indicators against defined business goals. As a result, leaders can compare current performance with strategic objectives.
7. AI Generated Insights
Summarizes significant changes, patterns, and areas that may need executive attention. Furthermore, these insights help reduce the effort required to interpret large amounts of portfolio data.
AI Executive Dashboard vs. Traditional Project Portfolio Dashboard
Both dashboards provide portfolio visibility, but they differ in how they process information and support decision making. A traditional project portfolio dashboard mainly presents existing data, while an AI powered approach adds analysis and intelligent insights. Therefore, the two approaches can provide different levels of support for executive reporting.
| Area | Traditional Dashboard | AI Executive Dashboard |
|---|---|---|
| Data | Displays collected information | Analyzes data to identify patterns |
| Reporting | Relies on predefined reports | Provides automated insights and summaries |
| Risk Detection | Shows known risks | Helps identify emerging concerns |
| Analysis | Requires manual interpretation | Supports faster data interpretation |
| Decision Support | Focuses on visibility | Helps highlight areas requiring action |
This difference makes AI powered dashboards more useful for executive reporting, where leaders need relevant information quickly rather than large volumes of raw project data. As a result, AI can help reduce the effort required to interpret portfolio information.
How Do AI and BI Work Together for Executive Reporting?
AI and BI complement each other by combining clear data visualization with intelligent analysis. BI helps leaders understand current portfolio performance, while AI helps identify patterns, changes, and areas that may require attention. Together, they provide a more complete view of portfolio information and support faster executive reporting.
1. Unified Data View
Combines information from projects, budgets, resources, risks, and performance metrics. As a result, executives can review important portfolio information from a more centralized view.
2. Interactive Reporting
Lets executives explore portfolio information through clear dashboards and visual reports. In addition, interactive reporting makes it easier to review specific areas when questions arise.
3. Intelligent Analysis
Identifies important patterns and changes across project data. Therefore, executives can focus on information that may require further attention.
4. Automated Summaries
Converts complex portfolio information into concise insights for leadership teams. Consequently, executives can understand important developments without reviewing every underlying report.
5. Predictive Visibility
Helps highlight potential risks, delays, and performance concerns earlier. As a result, leadership teams can review emerging issues before they become more significant.
6. Faster Decisions
Gives executives relevant information without requiring extensive manual analysis. Therefore, leaders can spend more time evaluating priorities and taking action.
How Executives Can Use AI Dashboards for Better Portfolio Decisions?
AI dashboards become valuable when executives use the information to connect project performance with broader business priorities. For example, the insights can support several critical portfolio decisions:
1. Prioritize Projects
Identify initiatives that deliver the strongest strategic value. As a result, leaders can focus attention on projects that align with important organizational priorities.
2. Manage Portfolio Risks
Focus attention on high impact risks and emerging concerns. Therefore, executives can review potential issues before they create larger portfolio problems.
3. Allocate Resources
Balance people, budgets, and capacity across competing projects. In addition, better visibility can help leaders identify resource constraints across the portfolio.
4. Control Costs
Track spending changes and address budget concerns early. Consequently, executives can maintain better visibility into portfolio-level financial performance.
5. Monitor Strategic Alignment
Ensure projects continue supporting organizational goals. As a result, leaders can identify projects that may require closer strategic review.
6. Identify Underperforming Projects
Detect projects that require intervention, restructuring, or closer oversight. Therefore, executives can review performance concerns and determine the appropriate next steps.
Ready to Make Portfolio Decisions with Greater Confidence?
Effective portfolio management depends on having clear, timely, and relevant information. AI powered dashboards help executives move beyond static reports by bringing project performance, risks, resources, costs, and priorities into a connected view. As a result, this enables faster decisions, stronger oversight, and better alignment between project execution and business objectives.
ChatPM helps organizations bring project management, AI, and BI together through a centralized platform designed for executive visibility. In addition, it provides insights across scope, cost, schedule, risks, issues, goals, KPIs, and other portfolio areas, helping leadership teams understand performance and act on important developments with greater confidence.